Investigations
The Switch 2 Sold 34% More Consoles and 16% Fewer Games Than the Switch 1 at the Same Age

SEO Title: Switch 2 vs Switch 1: 34% more hardware, 16% fewer games
Excerpt: Nintendo's own filings put the two launches side by side. At the same age, the Switch 2 has sold 26.35 million consoles and 73.21 million games; the Switch 1 had sold 19.67 million consoles and 86.93 million games. A third more hardware, 15.8% less software — and the shortfall has widened at every quarter-end since launch.
Category: Investigations
Tags: Nintendo, Switch 2, Switch, software attach rate, platform economics, earnings
Published-at: 2026-11-06 09:00
Document IDs: Nintendo FY2026 Q2 tanshin (261105e), Nintendo FY2025 Q2 tanshin (251104e), Nintendo FY2025 full-year tanshin (260508e), Nintendo FY2018 Q1 tanshin (180731e), Nintendo Top Selling Title Sales Units (as of 2026-09-30)
Nintendo published two documents eight years apart that nobody has put beside each other. Read together, they describe the strangest launch in the company's history: the fastest-selling console Nintendo has ever shipped is also the one its owners buy the fewest games for.
The first document is the first-quarter results statement for the fiscal year ending March 2018, filed on 31 July 2018. It reports that the Nintendo Switch, launched on 3 March 2017, had by 30 June 2018 sold 19.67 million consoles and 86.93 million games. That is 4.42 games for every console sold, 15.9 months after launch.
The second is the second-quarter results statement for the fiscal year ending March 2027, filed on 5 November 2026. It reports that the Nintendo Switch 2, launched on 5 June 2025, had by 30 September 2026 sold 26.35 million consoles and 73.21 million games. That is 2.78 games per console, 15.8 months after launch.
Both figures come from the same table in the same document series, computed the same way, with the same inclusion rules for packaged, downloaded and bundled software. The elapsed time differs by nine days. The comparison is as close to a controlled experiment as the console business offers.
| At the same age (≈16 months) | Switch 1 | Switch 2 | Change |
|---|---|---|---|
| Hardware, worldwide | 19.67 m | 26.35 m | +34.0% |
| Software, worldwide | 86.93 m | 73.21 m | −15.8% |
| Games per console | 4.42 | 2.78 | −37.1% |
The gap did not open once. It opened every quarter.
Attach rate is not a number Nintendo publishes. It has to be assembled from the sales-units table that each quarterly statement carries, and the table is only comparable if you line up the fiscal quarter-ends by months elapsed rather than by calendar date — the Switch launched in March, the Switch 2 in June, so their quarter-ends fall four, ten, thirteen and sixteen months after each launch respectively. The two calendars happen to align almost exactly.
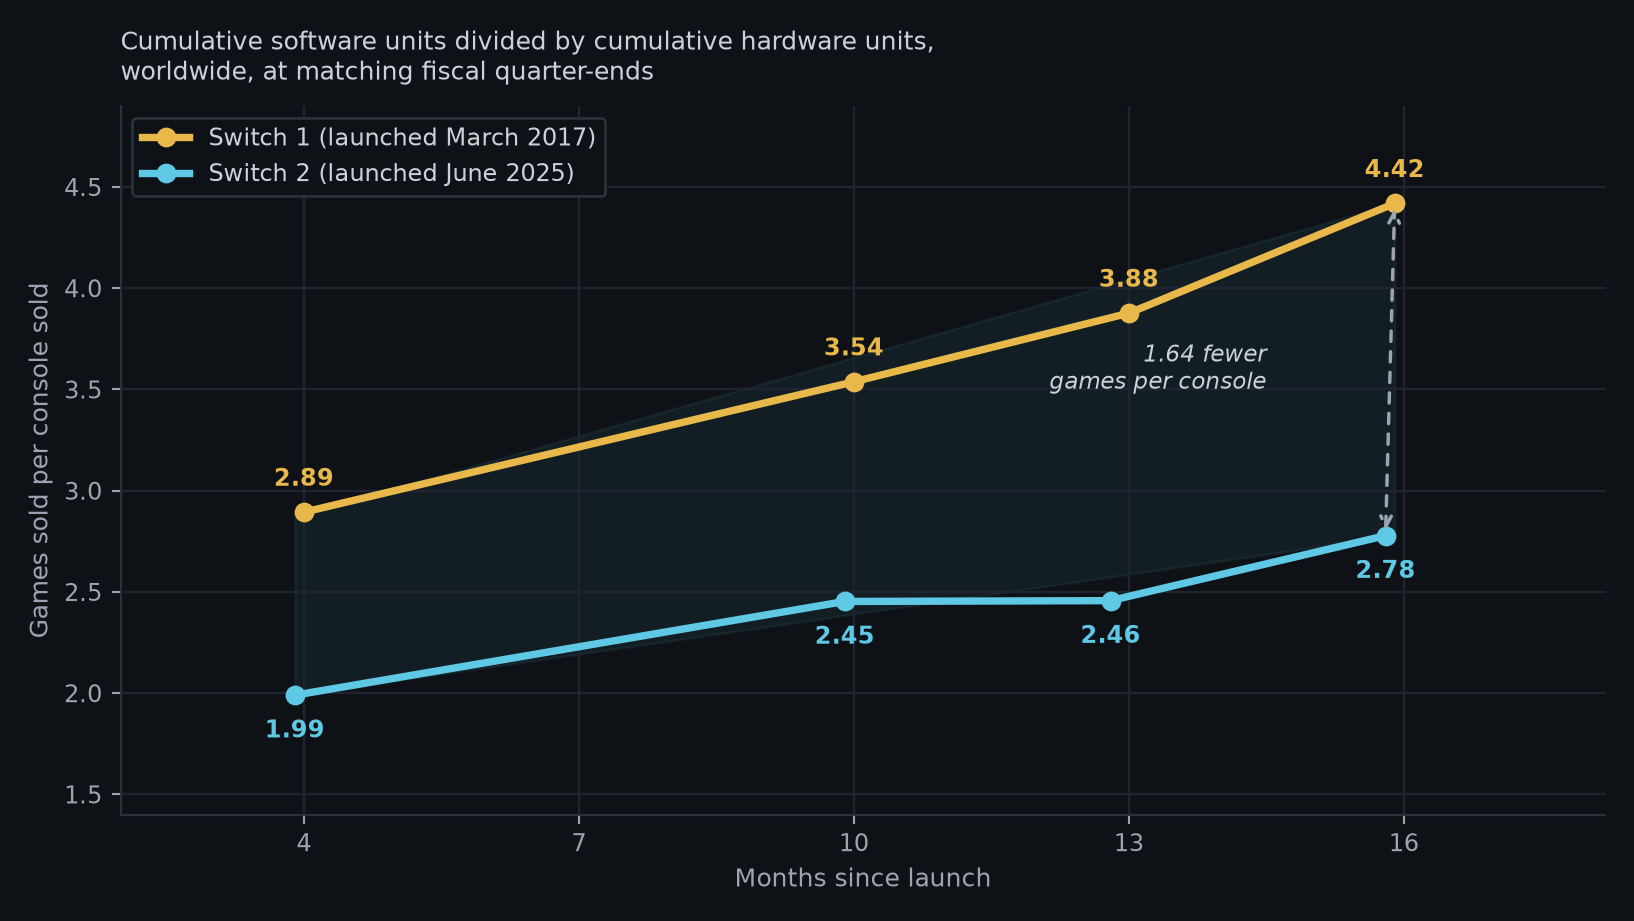
At four months, the Switch 2 was at 1.99 games per console against the Switch 1's 2.89 — a shortfall of 0.90. At ten months it was 2.45 against 3.54. At thirteen months, 2.46 against 3.88. At sixteen months, 2.78 against 4.42. The Switch 1 curve climbs at every measurement. The Switch 2 curve is nearly flat for a year and then bends up slightly. The absolute gap has widened from 0.90 games to 1.64.
This is the opposite of what a launch cycle normally does. A new platform's attach rate usually starts high and decays as late adopters arrive; the Switch 1 did the reverse, because Nintendo kept releasing system-sellers — Splatoon 2 in July 2017, Super Mario Odyssey in October, Mario Kart 8 Deluxe and The Legend of Zelda: Breath of the Wild still selling — into a base that was growing more slowly than the software. The Switch 2 has the hardware curve of a record launch and the software curve of a mid-cycle refresh.
Three mechanisms, one of which Nintendo states out loud
The first is backwards compatibility, and it is not a hypothesis. It is in the company's own commentary. In the current half-year statement, Nintendo attributes part of its software performance to the fact that "consumers can also play Nintendo Switch software with Nintendo Switch 2" and that "titles released in past fiscal years have also shown stable sales." In the six months to 30 September 2026, Nintendo sold 65.73 million Switch 1 games and 24.49 million Switch 2 games. The nine-year-old platform outsold the new one by 2.7 to 1.
Per console, the picture is less dramatic — Switch 2 owners bought 0.93 games each in the half-year against 0.42 for the far larger Switch 1 base — but the direction of trade is clear. Switch 2 buyers are buying into a catalogue, not a platform. A person who buys a Switch 2 in 2026 and picks up Mario Kart 8 Deluxe or Animal Crossing: New Horizons is recorded as a Switch 1 software sale, permanently, in the only dataset the industry uses to size the platform.
The second is the release slate. Nintendo's own list of million-sellers for the fiscal half names three new Switch 2 titles: Star Fox (1.17 m), Splatoon Raiders (2.42 m) and Fire Emblem: Fortune's Weave (1.34 m). The three together sold 4.93 million units — fewer than Mario Kart World alone sold between the hardware launch and 30 September 2025, when it reached 9.57 million including bundles. The heavy hitters Nintendo is holding for the next financial period are a Zelda: Ocarina of Time remake, Nintendo Switch Sports Resort and Metroid Ravenous, and the first of them is a remake of a 1998 game.
The third is price. A first-party Switch 2 title sells for $79.99 in the United States where the equivalent Switch 1 title sold for $59.99. Nintendo does not break out software revenue by platform, so the unit count cannot be converted into money directly — but the company's digital line, which is mostly software, rose 60.5% to ¥249.6 billion in the half-year, and digital accounted for 60.7% of software sales. Fewer units, more revenue per unit, is a coherent strategy. It is also a different strategy from the one the attach-rate metric was built to describe.
One game is a fifth of the platform
Nintendo's million-seller table for the Switch 2, as of 30 September 2026, lists nine titles. Mario Kart World accounts for 16.48 million of the 73.21 million Switch 2 games sold — 22.5% of the entire platform's software in one title, more than a year after launch.
At the equivalent point in the Switch 1's life, its best-selling game, Mario Kart 8 Deluxe, had sold 10.35 million of 86.93 million — 11.9% of the platform. The Switch 1's software base was twice as diffuse as the Switch 2's: its flagship was a smaller share of a larger library, and unlike the Switch 2's, that library had been fed by a steady cadence of new system-sellers rather than one launch title.
The concentration has a practical consequence for every publisher that is not Nintendo. The nine disclosed million-sellers are all Nintendo titles. If 57% of a platform's software units are Nintendo's own, in nine games, then the addressable market for a third-party release is a fraction of what "26 million consoles sold" implies — and it is a fraction that Nintendo's own first-party cadence can expand or contract at will.
The footnote that makes the number generous
There is an accounting wrinkle in Nintendo's disclosure that cuts against the finding, and it is worth stating precisely because it strengthens rather than weakens the conclusion.
Nintendo's top-selling-titles page carries this note: "Packaged versions of Nintendo Switch 2 Edition software are included in Nintendo Switch 2 software sales units, and downloadable versions are included in Nintendo Switch software sales units."
A "Switch 2 Edition" is a Switch 1 game resold with enhanced resolution or frame rate. Buy it in a box and the unit is counted as Switch 2 software. Buy the same upgrade as a download and it is counted as Switch 1 software. Two titles in the Switch 2 million-seller list are Switch 2 Editions — Pokémon Legends: Z-A at 4.04 million and Super Mario Party Jamboree at 1.28 million — and both are counted in the 73.21 million.
Strip those 5.32 million packaged re-releases out and the Switch 2's attach rate falls from 2.78 to 2.58, and its shortfall against the Switch 1 widens from 37% to 42%. The 2.78 figure is, if anything, flattering. The downloadable half of the same trade is counted on the other side of the ledger, inflating the Switch 1's 86.93 million — which means the true like-for-like gap is larger than the headline comparison shows, not smaller.
The honest counter-case
The strongest argument that this is a non-story is that Nintendo's software business is growing, not shrinking. Total software units across both platforms rose 9.8% year-on-year to 90.22 million in the half-year. Digital revenue rose 60.5%. Operating profit rose 49.1%. If fewer games per console came with less money, that would be a problem; it came with more.
That argument is correct on revenue and wrong on platform. Net sales fell 12.1% to ¥966.0 billion because hardware units fell 36.7%, and the dedicated platform segment fell 15.3% to ¥903.3 billion — more games, less money, because the mix moved toward cheaper legacy software and away from hardware. The growth in Nintendo's profit line is coming from the 157-million-unit Switch 1 installed base and from price, not from the Switch 2's software ecosystem. And part of it is coming from a tariff refund: Nintendo's own presentation states that operating profit was supported by "refunds received during the first quarter for U.S. tariffs imposed under IEEPA that had previously been recorded as cost of sales." In its results briefing, as reported by GamesIndustry.biz, the company added that the tariffs "related to the refunds were primarily borne by the company rather than passed on to consumers through product prices" — an unusual admission from a hardware maker that raised prices during the tariff period.
What Nintendo is guiding for
The most telling number in the 5 November filing is the one that did not change. Nintendo left its full-year forecast untouched: net sales of ¥2,050.0 billion, down 11.4%, and operating profit of ¥370.0 billion, up 2.7%.
Subtract the ¥216.5 billion already booked in the first half and Nintendo is guiding to ¥153.5 billion of operating profit in the October–March half. In the same half last year it made ¥215.0 billion. That is a guided decline of 28.6% in the half that contains the holiday quarter — with a larger installed base, a Zelda remake and Metroid Ravenous still to come.
A company that expected its new platform to carry the year would not guide that way. Nintendo is telling investors, in the only language a filing allows, that it expects the Switch 2's second holiday to be weaker than the Switch 1's ninth.
Method and limits
All unit figures are Nintendo's own, taken from the consolidated sales-units table of each quarterly results statement and cross-checked against the company's life-to-date hardware and software page. Elapsed months are measured from the Japanese launch dates of 3 March 2017 and 5 June 2025 to the relevant fiscal quarter-end. The June 2026 cumulative point is derived by subtracting the disclosed April–June 2026 quarter from the disclosed six-month total; every other point is disclosed directly. Attach rate is defined here as cumulative software units divided by cumulative hardware units, worldwide, and inherits Nintendo's inclusion of bundled software — a rule that has applied consistently to both platforms and that inflates the Switch 2's figure more than the Switch 1's, because the Switch 2 launched with a paid Mario Kart World bundle.
The comparison cannot tell us what the Switch 2's lifetime attach rate will be. It can tell us what the platform looks like to a publisher sizing a 2027 release today, and it is not what 26 million consoles suggests.
Sources
- Nintendo, Consolidated Financial Results for the Six Months Ended September 30, 2026 (tanshin, filed 5 November 2026)
- Nintendo, Financial Results Explanatory Material, six months ended 30 September 2026
- Nintendo, Consolidated Financial Results for the Six Months Ended September 30, 2025
- Nintendo, Consolidated Financial Results for the Fiscal Year Ended March 31, 2026
- Nintendo, Consolidated Financial Results for the Three Months Ended June 30, 2026
- Nintendo, Consolidated Financial Results for the Three Months Ended June 30, 2017
- Nintendo, Consolidated Financial Results for the Six Months Ended September 30, 2017
- Nintendo, Consolidated Financial Results for the Nine Months Ended December 31, 2017
- Nintendo, Consolidated Financial Results for the Fiscal Year Ended March 31, 2018
- Nintendo, Consolidated Financial Results for the Three Months Ended June 30, 2018
- Nintendo, Financial Results Explanatory Material, three months ended 30 June 2018 (million-seller table)
- Nintendo IR, Top Selling Title Sales Units (as of 30 September 2026)
- Nintendo IR, Dedicated Video Game Sales Units (life-to-date hardware and software)
- GamesIndustry.biz, "Nintendo H1 operating profit rises 49.1% supported by new titles including Splatoon Raiders", 5 November 2026